יום חמישי, 28 בפברואר 2019

ITF World Tour Structure - The Problem of Two Ranking Systems


Since the launch of the new ITF World Tour, a lot of criticism has been raised, mainly about the fact that most players cannot enter any tournament, and these include top college players, which are shown to be suited well for Pro Tennis.

What I would like to present here, is that even for players who can get into tournaments under the new system, including ITF top 100 juniors, it would be almost impossible to break through.
The women's path has became much harder and longer, but the biggest problem is on the men's side, since there are no qualifying places to ATP Ranked players (seems counter-intuitive, but I'll show why it is the case).

As you might know, the new system has two separate ranking systems - ITF World Tennis Rankings for ITF tournaments (15K$ and 25K$), and ATP Rankings for Challengers and above.
The problem is, that each tournament lasts for its relevant rankings for only 12 months.
That means that in a time-span of 12 months, a player should have a high enough ITF Rankings (about 20th) to be able to enter ATP challengers, and then also high enough ATP Rankings (about 320th) to be able to continue enter ATP Challengers using the ATP Rankings.

Let's look at the top 20 ITF players and do the math:
These players played 16 ITF tournaments where they achieved 54 ITF Points in each one of them (on average).
In order to be ranked 20th which would be enough in order to enter some challengers, 740 points are enough, which equals to five M25 wins!,
On average it would take a top 20 ITF player 14 tournaments to achieve that. Let's say a player plays 14 tournaments in 6 months time span (which is quite a lot of play given he had to go deep in some of them). Then, he has only 6 month until his ITF points starts to drop and he can no longer enter ATP Challengers using his ITF Rankings.
He needs about 90 ATP Points during the 6 months in order to be ranked 320th in the world. The player ranked 250th on the ATP achieve exactly double this amount of points in a full year (180 points), and remember some of the players around that ranking had also access to ATP and Grand Slam Qualifying, where they could get their points from.
So in order to be able to be ranked 320th in the world, our player who only have 6 months need to have a better performance than the 250th best player in the world, in a 12 months time where he had to play about 28 tournaments - that just to get into the cycle of playing ATP challengers! How crazy is that?

Now remember that if our player missed the needed points even by a little, he needs to start over on the ITF almost from scratch, since his ITF Ranking points would start to drop*. The exception to that is of course getting a WC, but players that are not from established Tennis countries don't have this luxury.
The solution might be to either go back to one unified ranking system, or to have a tour card for a full year, where a player can have access to ATP Challengers, as it is being done at both professional Golf and Snooker.

* Unlike ATP Rankings which are exponential in nature, the ITF Rankings tend to be linear, since many players can win tournaments in a given week, so using the ITF Rankings for Challengers Qualifying means that once ITF Points start to drop, a player's ITF Rankings drops dramatically.

** Combining ITF tournaments and Challengers on the player's schedule in order to have both rankings at the same time would actually lower the chances of becoming a regular ATP player. It does makes sense from a financial point of view of course.
יום ראשון, 2 בדצמבר 2018

UEFA Euro 2020 Qualifying Simulations - Draw Impact

As always, the group stage draw has winners and losers.
Clearly the group of life is group G, where all teams raised there chances of qualifying
Turkey is also a winner, and it actually the second highest ranked team in its group according to ELO (although Iceland still has higher chances of qualifying including the playoffs).
Northern Ireland decreased their chances the most by drawing Germany from Pot 2.
Group F is the group of death, with 4 teams capable of qualifying and all teams lowering their chances of qualifying.

The simulations are based on World Football Elo Ratings and are done by Poisson simulation system described here: Football Club Elo Ratings.

Summary by group:

Group Difference
A 12.56%
B -9.48%
C -15.12%
D -11.83%
E -8.50%
F -28.87%
G 35.85%
H 19.78%
I 1.64%
J 3.97%

Here are the results for 100K simulations:

Team Group ELO Points Q-normal Q-PO Q_Total Before_Draw Difference
Turkey H 1691 17.55 50.19% 8.09% 58.27% 42.96% 15.31%
Austria G 1765 19.67 79.68% 5.67% 85.35% 72.77% 12.57%
Slovenia G 1561 13.37 16.74% 0.00% 16.74% 8.84% 7.90%
Poland G 1752 19.31 76.68% 6.96% 83.63% 76.24% 7.40%
Montenegro A 1589 8.75 16.48% 0.01% 16.49% 11.49% 5.00%
Israel G 1561 13.37 16.69% 7.69% 24.38% 19.80% 4.59%
Scotland I 1721 18.71 43.91% 21.27% 65.18% 61.17% 4.00%
Albania H 1515 13.00 8.70% 0.04% 8.74% 5.18% 3.56%
Bosnia and Herzegovina J 1795 19.80 74.05% 9.54% 83.58% 80.19% 3.40%
Macedonia G 1519 12.05 9.97% 27.74% 37.72% 34.48% 3.23%
Bulgaria A 1629 9.70 24.04% 12.19% 36.23% 33.57% 2.66%
Serbia B 1807 15.11 60.75% 16.28% 77.03% 74.86% 2.17%
Germany C 1938 16.95 93.95% 3.02% 96.98% 94.88% 2.09%
Kosovo A 1496 6.56 5.70% 16.99% 22.69% 20.65% 2.04%
Czech Republic A 1729 12.30 56.82% 9.47% 66.29% 64.64% 1.65%
Slovakia E 1748 12.59 46.08% 12.66% 58.74% 57.21% 1.53%
Greece J 1613 14.64 16.05% 0.36% 16.42% 15.02% 1.40%
Italy J 1889 22.33 90.82% 4.22% 95.04% 93.74% 1.30%
England A 1960 18.39 96.97% 1.66% 98.62% 97.41% 1.21%
Iceland H 1668 16.93 41.01% 12.02% 53.02% 52.56% 0.46%
Netherlands C 1985 17.99 96.71% 1.91% 98.62% 98.20% 0.41%
Moldova H 1326 8.11 0.47% 0.00% 0.47% 0.23% 0.24%
France H 2094 26.71 99.64% 0.24% 99.88% 99.67% 0.21%
Latvia G 1298 5.74 0.25% 0.00% 0.25% 0.08% 0.16%
Belgium I 2036 25.67 97.95% 1.32% 99.27% 99.18% 0.09%
Kazakhstan I 1330 9.41 0.29% 0.00% 0.29% 0.24% 0.04%
San Marino I 836 1.44 0.00% 0.00% 0.00% 0.00% 0.00%
Gibraltar D 1103 1.49 0.00% 0.00% 0.00% 0.00% 0.00%
Andorra H 1081 3.14 0.00% 0.00% 0.00% 0.00% 0.00%
Liechtenstein J 1138 2.95 0.00% 0.00% 0.00% 0.00% 0.00%
Malta F 1178 3.80 0.00% 0.00% 0.00% 0.01% -0.01%
Faroe Islands F 1255 5.07 0.01% 0.00% 0.01% 0.06% -0.06%
Cyprus I 1415 11.23 1.16% 0.00% 1.16% 1.30% -0.14%
Luxembourg B 1348 4.58 0.16% 1.47% 1.63% 1.84% -0.20%
Lithuania B 1337 4.38 0.15% 0.00% 0.15% 0.39% -0.25%
Azerbaijan E 1403 4.23 0.61% 0.01% 0.62% 0.90% -0.28%
Armenia J 1449 9.96 1.59% 0.23% 1.82% 2.19% -0.37%
Denmark D 1898 16.72 83.33% 7.84% 91.17% 91.97% -0.80%
Croatia E 1925 17.03 89.50% 5.44% 94.94% 95.85% -0.90%
Hungary E 1611 9.11 13.06% 7.94% 21.00% 22.41% -1.41%
Portugal B 1959 18.25 90.25% 5.52% 95.77% 97.36% -1.59%
Spain F 2012 23.66 92.41% 4.80% 97.21% 98.81% -1.60%
Georgia D 1547 8.94 4.33% 33.63% 37.95% 39.59% -1.64%
Finland J 1622 14.89 17.49% 14.61% 32.10% 33.86% -1.75%
Switzerland D 1922 17.23 87.04% 6.85% 93.89% 95.82% -1.94%
Estonia C 1468 5.51 0.76% 0.00% 0.76% 2.85% -2.10%
Russia I 1753 19.51 56.70% 11.93% 68.63% 70.99% -2.36%
Belarus C 1539 6.97 2.14% 19.93% 22.07% 25.33% -3.26%
Wales E 1760 12.91 50.74% 13.22% 63.96% 71.39% -7.43%
Republic of Ireland D 1705 12.43 25.30% 12.05% 37.36% 44.82% -7.46%
Sweden F 1852 19.86 63.28% 15.06% 78.34% 87.01% -8.67%
Romania F 1753 17.44 30.08% 7.31% 37.39% 46.17% -8.78%
Ukraine B 1772 14.34 48.69% 17.55% 66.24% 75.85% -9.61%
Norway F 1679 15.52 14.22% 27.07% 41.29% 51.04% -9.75%
Northern Ireland C 1623 8.87 6.44% 8.22% 14.66% 26.93% -12.27%

יום רביעי, 21 בנובמבר 2018

UEFA Euro 2020 Qualifying Simulations - Post Nations League GS

After UEFA Nations League 2018 group stage is over, it's time to look forward to UEFA Euro 2020 main qualifying.
The simulations are based on World Football Elo Ratings and are done by Poisson simulation system described here: Football Club Elo Ratings.
The biggest winner since the previous simulations is Norway, who managed not only to win its group, but also finish with the second best record of all Group C teams, and then guaranteed playing at home at the playoffs if it wont qualify directly.
The biggest loser is Iceland, who did not manage to make a surprise at both FIFA World Cup 2020 and UEFA Nations League 2018 GS., including some heavy defeats.

Here are the results for 100K simulations:

TeamLeagueELOPointsRank 1Rank 2Rank 3Rank 4-6Q-normalQ-POPO-FinalPO-semisQ_TotalUp/Down
SwitzerlandA1922.0020.2965.6%25.6%7.4%1.4%91.2%4.7%2.8%1.3%95.8%5.1%
PortugalA1959.0020.9372.1%21.8%5.3%0.8%93.9%3.5%1.8%0.9%97.4%-1.2%
NetherlandsA1985.0021.3976.3%19.2%3.9%0.6%95.5%2.7%1.3%0.5%98.2%6.7%
EnglandA1960.0020.9672.5%21.6%5.1%0.8%94.0%3.4%1.7%0.9%97.4%1.6%
BelgiumA2036.0022.1983.4%14.3%2.1%0.2%97.7%1.5%0.6%0.3%99.2%3.2%
FranceA2094.0023.0089.2%9.7%1.1%0.1%98.9%0.8%0.2%0.1%99.7%1.7%
SpainA2012.0021.8580.4%16.4%2.9%0.3%96.8%2.1%0.8%0.4%98.8%-0.4%
ItalyA1889.0019.7059.3%28.6%9.8%2.2%88.0%5.8%3.9%2.4%93.7%-2.6%
CroatiaA1925.0020.3666.3%25.2%7.2%1.3%91.5%4.4%2.5%1.7%95.8%6.5%
PolandA1752.0016.9331.4%34.3%23.4%11.0%65.6%10.6%11.9%11.9%76.2%-13.2%
GermanyA1938.0019.7444.7%44.4%9.6%1.4%89.1%5.8%2.8%2.3%94.9%-4.9%
IcelandA1668.0014.336.6%33.9%34.9%24.6%40.5%12.0%18.9%28.3%52.6%-35.4%
Bosnia and HerzegovinaB1795.0017.0220.1%47.9%24.1%8.0%68.0%12.2%11.0%8.8%80.2%19.0%
UkraineB1772.0016.5317.0%46.3%26.6%10.1%63.3%12.6%12.5%11.6%75.9%14.2%
DenmarkB1898.0019.0137.3%47.2%13.1%2.4%84.5%7.5%4.3%3.7%92.0%14.9%
SwedenB1852.0018.1329.1%48.9%17.8%4.3%78.0%9.0%6.4%6.6%87.0%11.7%
RussiaB1753.0016.1614.7%44.6%28.6%12.2%59.3%11.7%12.2%16.8%71.0%17.0%
AustriaB1765.0016.3916.1%45.7%27.3%10.9%61.8%11.0%10.8%16.5%72.8%18.9%
WalesB1760.0016.2915.6%45.3%27.6%11.5%60.9%10.5%10.6%18.0%71.4%-0.1%
Czech RepublicB1729.0015.6311.8%42.3%30.8%15.1%54.0%10.6%11.5%23.6%64.6%15.6%
SlovakiaB1748.0015.4511.3%32.1%40.5%16.1%43.4%13.8%13.9%28.4%57.2%-9.8%
TurkeyB1691.0014.246.4%25.0%43.7%24.8%31.4%11.5%14.2%41.5%43.0%-21.3%
Republic of IrelandB1705.0014.537.5%26.9%42.9%22.6%34.4%10.4%11.7%40.2%44.8%-26.2%
Northern IrelandB1623.0012.833.0%16.7%42.8%37.4%19.7%7.2%11.5%51.3%26.9%-20.6%
ScotlandC1721.0014.888.9%28.8%42.2%20.2%37.7%23.5%21.0%17.8%61.2%5.9%
NorwayC1679.0014.015.6%23.7%44.0%26.8%29.2%21.8%22.6%26.4%51.0%28.2%
SerbiaC1807.0016.6718.7%37.7%34.2%9.4%56.4%18.4%10.9%14.3%74.9%12.4%
FinlandC1622.0012.802.9%16.7%42.7%37.7%19.6%14.3%18.9%47.2%33.9%14.0%
BulgariaC1629.0012.943.3%17.5%42.9%36.4%20.7%12.8%17.1%48.8%33.6%9.0%
IsraelC1561.0011.551.3%10.4%37.9%50.4%11.7%8.1%14.0%60.7%19.8%8.2%
HungaryC1611.0011.872.3%12.1%28.6%57.0%14.4%8.0%10.2%46.4%22.4%-3.9%
RomaniaC1753.0014.7910.9%28.0%33.6%27.5%38.9%7.3%4.9%18.2%46.2%1.1%
GreeceC1613.0011.932.4%12.2%28.9%56.5%14.6%0.4%0.5%1.8%15.0%-23.6%
AlbaniaC1515.009.890.5%4.6%18.5%76.4%5.1%0.1%0.1%0.4%5.2%-16.9%
MontenegroC1589.0011.411.6%9.8%26.8%61.7%11.5%0.0%0.0%0.0%11.5%-12.9%
CyprusC1415.008.000.1%1.2%8.8%89.9%1.3%0.0%0.0%0.0%1.3%-1.0%
EstoniaC1468.008.960.2%2.6%13.3%83.8%2.9%0.0%0.0%0.0%2.9%-3.7%
SloveniaC1561.0010.841.2%7.7%23.7%67.5%8.8%0.0%0.0%0.0%8.8%-23.3%
LithuaniaC1337.006.680.0%0.4%4.2%95.4%0.4%0.0%0.0%0.0%0.4%-1.5%
GeorgiaD1547.0010.560.9%6.6%22.2%70.3%7.5%32.1%28.0%32.4%39.6%19.3%
MacedoniaD1519.009.130.5%4.2%14.9%80.4%4.7%29.8%32.1%33.4%34.5%9.1%
KosovoD1496.008.680.4%3.2%12.7%83.7%3.6%17.1%20.2%59.2%20.7%16.5%
BelarusD1539.009.520.7%5.2%17.0%77.0%6.0%19.4%16.6%58.1%25.3%-1.0%
LuxembourgD1348.006.030.0%0.3%3.1%96.6%0.4%1.5%2.8%15.9%1.8%-0.7%
ArmeniaD1449.007.780.1%1.8%8.5%89.6%1.9%0.2%0.3%1.0%2.2%-11.4%
AzerbaijanD1403.006.950.1%0.8%5.5%93.6%0.9%0.0%0.0%0.1%0.9%-10.1%
KazakhstanD1330.005.730.0%0.2%2.5%97.3%0.2%0.0%0.0%0.0%0.2%-3.1%
MoldovaD1326.005.700.0%0.2%2.3%97.4%0.2%0.0%0.0%0.0%0.2%-2.8%
GibraltarD1103.003.060.0%0.0%0.1%99.9%0.0%0.0%0.0%0.0%0.0%0.0%
Faroe IslandsD1255.004.700.0%0.1%0.9%99.0%0.1%0.0%0.0%0.0%0.1%-1.7%
LatviaD1298.005.760.0%0.1%1.1%98.8%0.1%0.0%0.0%0.0%0.1%-6.0%
LiechtensteinD1138.003.490.0%0.0%0.1%99.9%0.0%0.0%0.0%0.0%0.0%-0.2%
AndorraD1081.002.880.0%0.0%0.0%100.0%0.0%0.0%0.0%0.0%0.0%0.0%
MaltaD1178.003.990.0%0.0%0.2%99.8%0.0%0.0%0.0%0.0%0.0%-0.6%
San MarinoD836.001.320.0%0.0%0.0%100.0%0.0%0.0%0.0%0.0%0.0%0.0%

יום רביעי, 24 בינואר 2018

UEFA Euro Qualifying - Nations League Impact

Hello,

Today I will make an analysis of the impact of the new change in UEFA Euro Qualifing System, in which 4 teams would qualify from the Nations League Playoffs.
I included in the analysis the following scenarios:

  1. The real system of UEFA Euro 2020 Qualifing
  2. A scenario for each team where it is assigned to one league above (lowest pot) 
  3. A scenario for each team where it is assigned to one league below (highest pot) 
  4. A system in which there are 8 group of 7-8 teams, where top 3 teams in each group qualify.
  5. A system in which there are 9 group of 6-7 teams, where top 2 teams + 3 best 3rd placed teams in each group qualify, and the other 3rd place teams go to playoffs (previous system).
  6. A system in which there are 11 group of 5 teams, where top 2 teams + 2 best 3rd placed teams in each group qualify.
The most interesting finding is that being in League A actually improves the chances of a team to qualify to Euro 2020 comparing to group B, and being in League B improves the chances of a team to qualify comparing to League C. It has two reasons:

  1. In 99.8% of the simulations, at least 8 League A teams qualified through the main qualifing, making all league A teams qualify at least for the playoffs. For League B, in 87% of the simulation all teams qualifies at least for the playoffs.
  2. The main qualifying seeding is based on the Nations League final standing, and higher league means higher seeding.

All scenarios are done with one million simulations of the draw and the matches (Elo ratings as of 1.12.2017). 
For full methodology please see:
https://simtheworld.blogspot.com/2012/09/uefa-cl-and-el-2012-13-simulations.html

Here are the full results:
Team League ELO Q-normal Q-up Q-down Q-8-groups Q_9-groups Q_11-groups
Germany A 2098.00 99.8% 99.6% 99.9% 99.9% 99.8%
Spain A 2015.00 99.2% 98.7% 99.5% 99.6% 99.2%
Portugal A 1982.00 98.7% 97.9% 99.2% 99.3% 98.7%
France A 1959.00 98.0% 96.6% 98.7% 99.0% 98.2%
Italy A 1920.00 96.5% 94.3% 97.7% 98.1% 96.8%
Belgium A 1910.00 96.0% 94.1% 97.2% 97.7% 96.4%
England A 1909.00 96.0% 94.2% 97.3% 97.7% 96.5%
Netherlands A 1854.00 91.7% 88.9% 92.4% 93.1% 89.5%
Switzerland A 1845.00 90.9% 86.9% 93.5% 94.0% 92.3%
Poland A 1835.00 89.6% 86.2% 90.6% 93.3% 91.6%
Croatia A 1833.00 89.2% 86.0% 90.4% 91.0% 91.3%
Iceland A 1822.00 88.0% 84.0% 89.2% 89.7% 90.2%
Denmark B 1781.00 77.1% 82.2% 72.2% 81.3% 80.3% 79.9%
Sweden B 1771.00 75.6% 81.0% 70.8% 79.6% 82.0% 78.4%
Wales B 1751.00 71.2% 77.5% 65.0% 78.0% 78.6% 74.8%
Republic of Ireland B 1750.00 71.0% 77.5% 65.2% 75.7% 74.6% 74.5%
Slovakia B 1732.00 67.1% 72.9% 61.0% 74.7% 74.6% 71.2%
Turkey B 1721.00 64.4% 71.2% 57.7% 69.6% 66.9% 60.2%
Ukraine B 1709.00 61.6% 68.9% 54.5% 65.4% 69.1% 66.5%
Bosnia and Herzegovina B 1706.00 61.1% 67.4% 53.8% 65.9% 64.3% 66.1%
Russia B 1680.00 54.3% 62.0% 46.0% 62.8% 62.0% 60.3%
Austria B 1678.00 53.6% 61.0% 45.8% 62.2% 61.9% 60.0%
Czech Republic B 1660.00 49.1% 56.7% 41.7% 54.6% 51.6% 46.5%
Northern Ireland B 1654.00 47.6% 55.5% 39.8% 53.2% 50.4% 54.6%
Serbia C 1737.00 62.6% 67.9% 78.4% 64.1% 61.5% 63.7%
Scotland C 1708.00 55.2% 61.8% 72.1% 57.2% 63.2% 57.7%
Romania C 1669.00 44.9% 51.2% 64.2% 47.2% 53.0% 48.4%
Greece C 1647.00 38.7% 45.7% 59.0% 41.9% 38.5% 43.2%
Slovenia C 1618.00 32.0% 38.4% 52.1% 34.4% 31.1% 36.8%
Hungary C 1593.00 26.2% 33.2% 44.9% 29.1% 33.3% 31.6%
Bulgaria C 1590.00 24.2% 32.3% 44.6% 21.9% 24.2% 22.2%
Montenegro C 1590.00 24.3% 32.1% 44.7% 22.2% 24.4% 30.8%
Norway C 1578.00 23.1% 30.3% 42.8% 25.5% 22.2% 28.4%
Albania C 1573.00 21.8% 28.7% 40.7% 24.5% 21.2% 27.3%
Finland C 1567.00 19.7% 28.5% 39.5% 17.8% 19.7% 18.7%
Israel C 1514.00 11.5% 17.0% 28.1% 10.2% 11.2% 11.4%
Estonia C 1476.00 6.7% 12.7% 21.0% 6.3% 4.9% 7.6%
Cyprus C 1399.00 2.2% 5.1% 9.7% 2.0% 1.5% 2.9%
Lithuania C 1385.00 1.8% 4.2% 9.5% 1.6% 1.1% 2.5%
Belarus D 1489.00 26.5% 8.1% 6.9% 5.8% 8.6%
Macedonia D 1484.00 25.4% 7.9% 6.5% 5.5% 8.2%
Georgia D 1457.00 20.2% 6.0% 4.5% 3.6% 6.0%
Armenia D 1439.00 13.8% 4.9% 3.3% 2.7% 4.8%
Azerbaijan D 1382.00 10.7% 1.8% 1.5% 1.0% 2.3%
Latvia D 1355.00 6.0% 1.2% 0.9% 0.6% 1.0%
Kosovo D 1351.00 4.2% 1.1% 0.6% 0.5% 1.0%
Kazakhstan D 1320.00 3.4% 0.7% 0.4% 0.2% 0.6%
Moldova D 1310.00 2.9% 0.5% 0.3% 0.2% 0.5%
Luxembourg D 1285.00 2.4% 0.4% 0.2% 0.1% 0.3%
Faroe Islands D 1258.00 1.7% 0.3% 0.1% 0.1% 0.2%
Malta D 1204.00 0.6% 0.1% 0.0% 0.0% 0.1%
Liechtenstein D 1128.00 0.1% 0.0% 0.0% 0.0% 0.0%
Gibraltar D 1049.00 0.0% 0.0% 0.0% 0.0% 0.0%
Andorra D 993.00 0.0% 0.0% 0.0% 0.0% 0.0%
San Marino D 835.00 0.0% 0.0% 0.0% 0.0% 0.0%

יום שבת, 2 בדצמבר 2017

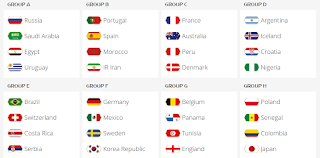
FIFA World Cup 2018 - Draw Analysis

The draw result for FIFA World Cup 2018 is (taken from FIFA.com):


Let's start by looking at the Elo Ratings of the teams by group:

Group Elo_Avg Elo_Std
A 1720.00 100.12
B 1866.50 133.92
C 1843.25 90.22
D 1821.50 98.89
E 1855.25 145.70
F 1857.25 142.42
G 1774.50 137.63
H 1803.75 70.06

The most balanced group is group H, and any final ranking seem reasonable.
Group A is the easiest group by far, and in fact it has one of the worst 3 teams from each one of the seeding pots according to Elo.
The hardest groups are groups B, E and F. On first look it would seem maybe that Portugal and Spain have a relatively easy draw, because of the bottom 2 teams in their group. Group E has 3 teams that reached the last 16 in FIFA World Cup 2014, and group F has last 16 regulars Germany and Mexico, in addition to giant slayer Sweden, that eliminated both Netherlands and Italy.
I made 1 million simulations of the tournament before and after the draw using Elo Ratings (adding 100 points for Russia for being hosts) in order to test the draw more scientifically:
The number represent the cumulative percentage change of reaching a certain position/round for all teams in the group.

GroupPoints1st2nd3rd4thR16QuartersSemisfinalwinner3rd
A2.9337.25%12.82%-9.92%-40.14%50.07%2.47%2.79%0.31%0.14%0.99%
B-1.46-23.43%-2.91%12.65%13.69%-26.34%13.23%10.91%2.02%1.06%4.65%
C-0.97-8.99%-7.49%-0.22%16.69%-16.47%-4.99%-0.96%-2.05%-0.66%0.57%
D0.013.58%-4.55%-1.34%2.31%-0.97%-0.28%0.50%-1.32%-0.52%0.81%
E-1.05-15.86%-0.09%2.97%12.98%-15.95%-20.38%-3.75%0.33%0.24%-2.04%
F-1.07-17.04%1.07%3.61%12.36%-15.98%-20.31%-3.53%-0.05%-0.79%-1.85%
G1.3313.38%6.27%0.68%-20.32%19.64%21.05%-0.95%1.36%0.69%-1.19%
H0.3011.12%-5.11%-8.43%2.42%6.00%9.20%-5.01%-0.60%-0.16%-1.94%

As expected, Group A teams were expected about 1.5 qualifications to R16 before he draw, and after the draw obviously 2 of them would qualify. When looking at the quarter finals, group H teams are actually the winners, avoiding the top 6 Elo teams until the quarter finals. Group B team are actually the winners when it comes to raising the probability of winning the tournament.
The losers of the draw when looking at the chance of going out in the group stage are Group B teams. It is easy to sometimes underestimate the bottom teams in the group, but their chance of qualifying is not negligible. Having Spain in that group reduced Portugal chance of qualifying significantly. When looking at the quarter finals probability, group E and F are the biggest losers, since they will meet each other in the R16, and both groups are very strong.
The results of the draw are very significant for the participating teams, but of course the games still need to be played, and the ability and luck their would b even more significant.

Here are the results by team (order by difference in R16 from lowest to highest):

Team Group Pot ELO Points 1st 2nd 3rd 4th R16 Quarters Semis final winner 3rd
Iran B 3 1791 -0.38 -5.63% -3.89% 6.70% 2.82% -9.52% 0.99% 0.86% 0.05% 0.02% 0.29%
Morocco B 4 1686 -0.48 -3.37% -4.61% -0.35% 8.33% -7.98% 0.06% 0.13% 0.00% 0.00% 0.03%
South Korea F 4 1702 -0.49 -4.56% -2.27% -1.95% 8.78% -6.83% -3.62% -0.65% -0.09% -0.02% -0.16%
Switzerland E 2 1845 -0.43 -10.22% 3.98% 3.21% 3.03% -6.24% -8.42% -2.25% -0.45% -0.17% -0.80%
Peru C 2 1866 -0.31 -4.72% -1.29% 2.53% 3.49% -6.01% -2.12% -0.54% -0.60% -0.18% -0.01%
Costa Rica E 3 1728 -0.39 -5.09% -0.47% -0.15% 5.71% -5.56% -4.14% -0.73% -0.11% -0.03% -0.21%
Serbia E 4 1752 -0.38 -5.30% -0.20% 1.08% 4.42% -5.50% -4.66% -0.97% -0.19% -0.06% -0.26%
Portugal B 1 1976 -0.39 -11.39% 5.97% 4.03% 1.40% -5.42% 5.71% 4.98% 1.38% 0.58% 1.78%
Mexico F 2 1833 -0.32 -8.27% 3.06% 3.59% 1.63% -5.22% -7.30% -1.81% -0.28% -0.09% -0.67%
Australia C 4 1718 -0.35 -1.77% -3.41% -3.73% 8.91% -5.19% -1.28% -0.30% -0.13% -0.03% -0.06%
Sweden F 3 1805 -0.28 -6.33% 2.53% 2.08% 1.72% -3.80% -5.60% -1.25% -0.17% -0.04% -0.42%
Croatia D 2 1838 -0.14 -1.29% -2.15% 1.35% 2.08% -3.44% -1.38% -0.28% -0.46% -0.15% 0.06%
Spain B 2 2013 -0.22 -3.04% -0.38% 2.27% 1.15% -3.42% 6.48% 4.95% 0.59% 0.45% 2.56%
France C 1 1969 -0.17 -1.45% -1.58% 1.36% 1.67% -3.03% -1.18% -0.03% -1.02% -0.36% 0.57%
Denmark C 3 1820 -0.14 -1.04% -1.20% -0.39% 2.62% -2.24% -0.40% -0.09% -0.30% -0.08% 0.07%
Poland H 1 1821 -0.09 -1.20% -0.62% 0.29% 1.52% -1.82% 1.45% -1.70% -0.16% -0.04% -0.64%
Nigeria D 4 1691 -0.05 -0.24% -0.11% -0.60% 0.96% -0.35% -0.20% 0.02% -0.03% -0.01% 0.01%
Germany F 1 2089 0.02 2.12% -2.25% -0.11% 0.24% -0.13% -3.79% 0.17% 0.49% -0.63% -0.60%
Tunisia G 3 1619 0.12 0.40% 0.34% 2.85% -3.58% 0.73% 1.06% -0.05% 0.00% 0.00% -0.01%
Iceland D 3 1791 0.03 0.46% 0.45% -0.70% -0.22% 0.91% 0.35% 0.23% -0.13% -0.04% 0.14%
Brazil E 1 2096 0.16 4.74% -3.40% -1.16% -0.18% 1.34% -3.16% 0.20% 1.07% 0.50% -0.77%
Argentina D 1 1966 0.17 4.65% -2.74% -1.39% -0.51% 1.91% 0.96% 0.54% -0.70% -0.34% 0.60%
Japan H 4 1735 0.06 2.01% -0.03% -2.69% 0.71% 1.98% 1.59% -0.50% -0.02% 0.00% -0.15%
Panama G 4 1656 0.25 0.81% 1.72% 6.19% -8.71% 2.52% 1.75% -0.04% 0.02% 0.00% -0.02%
Senegal H 3 1748 0.11 2.71% 0.06% -3.28% 0.51% 2.77% 2.04% -0.58% -0.05% 0.00% -0.18%
Colombia H 2 1911 0.21 7.59% -4.52% -2.75% -0.31% 3.07% 4.11% -2.23% -0.37% -0.12% -0.96%
Belgium G 1 1909 0.44 3.74% 4.05% -3.71% -4.08% 7.79% 8.98% -0.32% 0.86% 0.39% -0.67%
England G 2 1914 0.52 8.44% 0.16% -4.64% -3.95% 8.60% 9.26% -0.54% 0.48% 0.29% -0.50%
Saudi Arabia A 4 1596 0.55 4.11% 4.86% 1.39% -10.37% 8.98% 0.13% 0.04% 0.00% 0.00% 0.01%
Egypt A 3 1654 0.73 6.34% 6.09% 0.86% -13.29% 12.42% 0.49% 0.17% 0.01% 0.00% 0.04%
Russia A 1 1781 0.71 9.11% 3.81% -4.27% -8.65% 12.92% 0.03% 0.80% 0.08% 0.02% 0.28%
Uruguay A 2 1849 0.94 17.69% -1.94% -7.91% -7.83% 15.75% 1.82% 1.78% 0.22% 0.11% 0.67%

Here are the Elo Weighted results (weighted 10^((elo ratings-1500)/400), because of Elo structure) :

Group Points 1st 2nd 3rd 4th R16 Quarters Semis final winner 3rd
A 13.33 2.00 0.28 -0.76 -1.52 2.28 0.15 0.18 0.02 0.01 0.07
B -13.52 -2.75 0.51 1.41 0.83 -2.24 2.18 1.77 0.33 0.18 0.78
C -7.16 -0.73 -0.54 0.26 1.01 -1.27 -0.42 -0.06 -0.22 -0.08 0.09
D 1.45 0.61 -0.53 -0.16 0.09 0.08 0.06 0.07 -0.14 -0.06 0.10
E -1.27 0.31 -0.79 -0.09 0.57 -0.48 -1.94 -0.17 0.29 0.14 -0.32
F -4.70 -0.45 -0.39 0.27 0.56 -0.83 -2.06 -0.16 0.11 -0.20 -0.25
G 11.09 1.34 0.49 -0.69 -1.14 1.83 2.01 -0.09 0.14 0.07 -0.12
H 2.43 0.92 -0.52 -0.52 0.11 0.40 0.68 -0.39 -0.05 -0.01 -0.16

For full methodology please see:
https://simtheworld.blogspot.com/2012/09/uefa-cl-and-el-2012-13-simulations.html
The exact procedure wasn't published yet, so I assumed the draw would be made in order of the pots (pot 1, then pot 2 and so on).

For the full simulation results see:
After the draw - http://simtheworld.blogspot.com/2017/12/fifa-world-cup-2018-simuations.html
Before the draw - http://simtheworld.blogspot.com/2017/11/fifa-world-cup-2018-pre-draw-simulation.html