Hello,
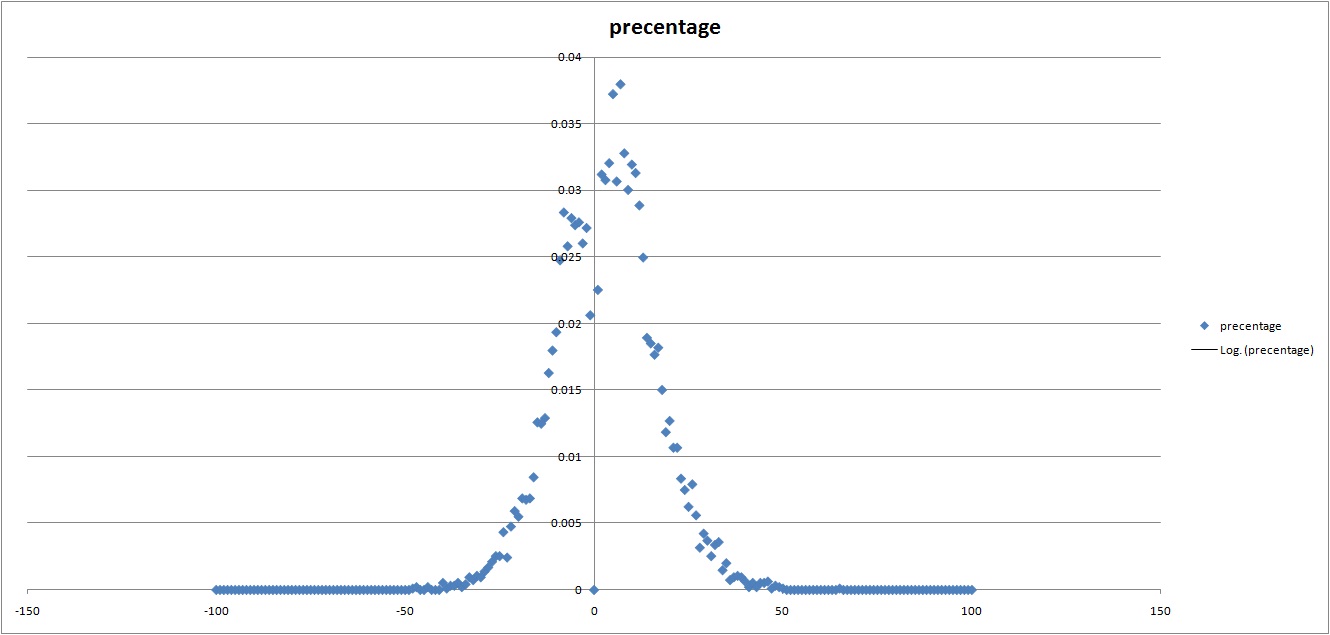
here is NBA score difference distribution from 1993 to 2001 (9457 matches).
The Most interesting thing is the low percentage of -1 and 1 - that probably because of fouls when down a little towards the end of the match.
Also, the home teams wins more than 60% of the matches, which is quite a lot.

here is NBA score difference distribution from 1993 to 2001 (9457 matches).
The Most interesting thing is the low percentage of -1 and 1 - that probably because of fouls when down a little towards the end of the match.
Also, the home teams wins more than 60% of the matches, which is quite a lot.
| difference | matches |
| 65 | 1 |
| 50 | 1 |
| 49 | 2 |
| 48 | 3 |
| 47 | 1 |
| 46 | 6 |
| 45 | 5 |
| 44 | 5 |
| 43 | 2 |
| 42 | 5 |
| 41 | 2 |
| 40 | 6 |
| 39 | 9 |
| 38 | 10 |
| 37 | 9 |
| 36 | 7 |
| 35 | 19 |
| 34 | 14 |
| 33 | 34 |
| 32 | 32 |
| 31 | 24 |
| 30 | 35 |
| 29 | 40 |
| 28 | 30 |
| 27 | 53 |
| 26 | 75 |
| 25 | 59 |
| 24 | 71 |
| 23 | 79 |
| 22 | 101 |
| 21 | 101 |
| 20 | 120 |
| 19 | 112 |
| 18 | 142 |
| 17 | 172 |
| 16 | 167 |
| 15 | 175 |
| 14 | 179 |
| 13 | 236 |
| 12 | 273 |
| 11 | 296 |
| 10 | 302 |
| 9 | 284 |
| 8 | 310 |
| 7 | 359 |
| 6 | 290 |
| 5 | 352 |
| 4 | 303 |
| 3 | 291 |
| 2 | 295 |
| 1 | 213 |
| -1 | 195 |
| -2 | 257 |
| -3 | 246 |
| -4 | 261 |
| -5 | 259 |
| -6 | 264 |
| -7 | 244 |
| -8 | 268 |
| -9 | 234 |
| -10 | 183 |
| -11 | 170 |
| -12 | 154 |
| -13 | 122 |
| -14 | 118 |
| -15 | 119 |
| -16 | 80 |
| -17 | 65 |
| -18 | 64 |
| -19 | 65 |
| -20 | 52 |
| -21 | 56 |
| -22 | 45 |
| -23 | 23 |
| -24 | 41 |
| -25 | 24 |
| -26 | 24 |
| -27 | 20 |
| -28 | 16 |
| -29 | 13 |
| -30 | 9 |
| -31 | 10 |
| -32 | 7 |
| -33 | 9 |
| -34 | 4 |
| -35 | 2 |
| -36 | 5 |
| -37 | 3 |
| -38 | 3 |
| -39 | 1 |
| -40 | 5 |
| -44 | 2 |
| -47 | 2 |
| -48 | 1 |